Isometric architecture diagrams as code: cloud diagrams in SVG from YAML
An isometric architecture diagram that lives in the repo, diffs in review and redraws itself when the system changes. The spec, the layout rules and a small generator in plain JavaScript.
By Homingo Learn ·
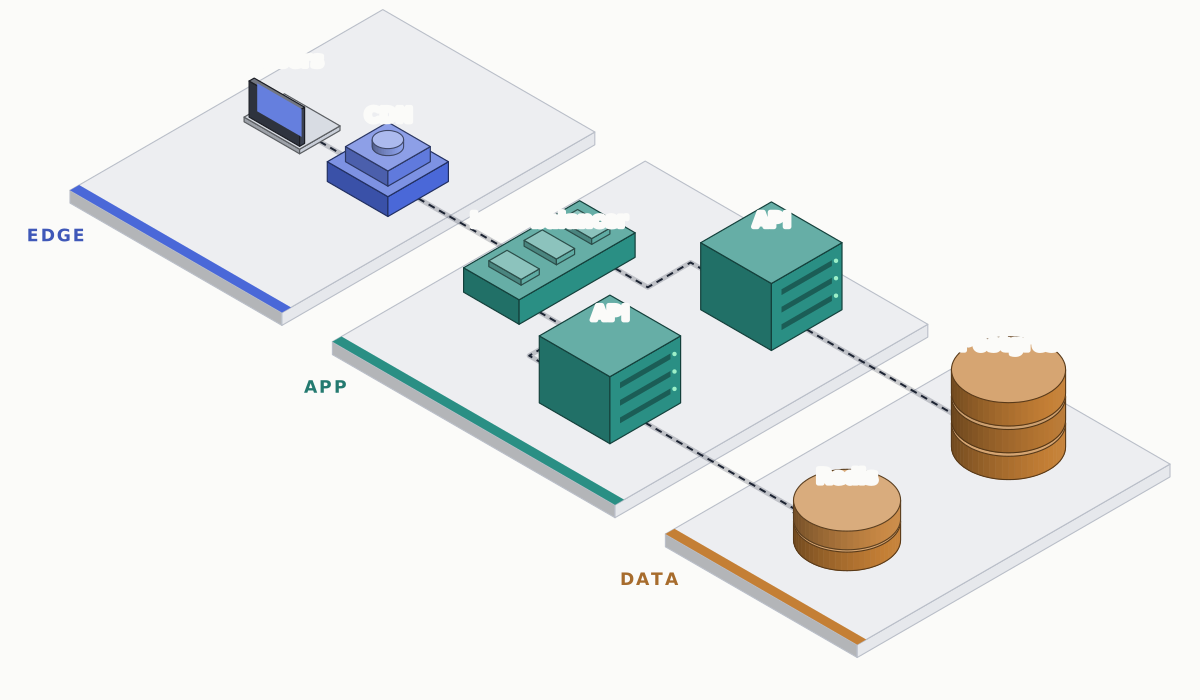
Isometric architecture diagrams are popular for a reason: a system drawn as zones and machines on a floor reads like a place, and people remember places. Most of them are made in drag-and-drop editors, though, and an exported PNG goes stale the week the system changes. Text-based tools such as Mermaid, D2 or Graphviz stay current but draw flat boxes. This guide joins the two: a short YAML file describes the system, and a script of a few hundred lines draws the isometric SVG from it, every time, in CI.
Describe the system, not the picture
The spec names zones, nodes and connections. Positions are in world units on a floor grid, never in pixels, so the drawing code can change scale, angle or style without touching the spec.
zones:
  - { id: edge, label: Edge, x: [0, 4.2], color: "#4a68d8" }
  - { id: app, label: App, x: [5.2, 10.8], color: "#2a8f84" }
  - { id: data, label: Data, x: [11.8, 15.6], color: "#c47f35" }

nodes:
  users:    { kind: client,  zone: edge, at: [1.1, 2.9],  label: Users }
  cdn:      { kind: cdn,     zone: edge, at: [3.0, 2.9],  label: CDN }
  lb:       { kind: lb,      zone: app,  at: [6.2, 2.9],  label: Load balancer }
  api-a:    { kind: service, zone: app,  at: [9.0, 1.3],  label: API }
  api-b:    { kind: service, zone: app,  at: [9.0, 4.5],  label: API }
  postgres: { kind: db,      zone: data, at: [13.7, 1.3], label: Postgres }
  redis:    { kind: cache,   zone: data, at: [13.7, 4.5], label: Redis }

edges:
  - [users, cdn]
  - [cdn, lb]
  - [lb, api-a]
  - [lb, api-b]
  - [api-a, postgres]
  - [api-b, redis]
docs/arch/system.yaml: the whole diagram at the top of this page.
Keep the kinds few: client, cdn, lb, service, queue, worker, db, cache covers most web systems. A new kind costs one small drawing function; a diagram with twenty kinds needs a legend, and a legend is a sign the picture is not explaining itself.
Lay out on a grid, then project
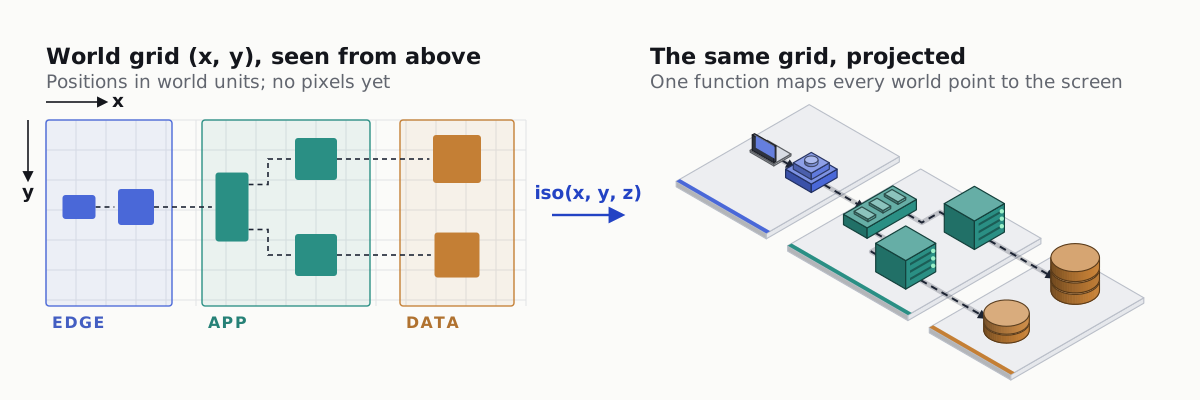
Zones run along the x axis in the order requests flow, and nodes sit inside their zone on the y axis. Flow from back-left to front-right is the convention readers expect from these diagrams. The projection itself is one line per axis: x runs down-right and y down-left at 30 degrees, z points up. Our isometric diagrams for docs guide explains the projection, shading and depth rules in more detail; here is the code.
import { readFileSync } from 'node:fs';
import YAML from 'yaml';

const spec = YAML.parse(readFileSync(new URL('./system.yaml', import.meta.url), 'utf8'));
const C30 = Math.cos(Math.PI / 6);
const U = 54, OX = 380, OY = 40, PH = 0.22; // unit, origin, platform height
const iso = (x, y, z = 0) => [OX + (x - y) * C30 * U, OY + (x + y) * 0.5 * U - z * U];
const pts = (list) => list.map((p) => iso(...p).map((v) => v.toFixed(1)).join(',')).join(' ');

// Move a hex colour toward white (t > 0) or black (t < 0).
const tone = (hex, t) =>
  '#' + [1, 3, 5].map((i) => {
    const c = parseInt(hex.slice(i, i + 2), 16);
    return Math.round(c + ((t > 0 ? 255 : 0) - c) * Math.abs(t)).toString(16).padStart(2, '0');
  }).join('');

// The three visible faces: +y (screen left, dark), +x (screen right, base), top (light).
function box(x, y, z, w, d, h, base) {
  const line = tone(base, -0.55);
  const face = (p, fill) => `<polygon points="${pts(p)}" fill="${fill}" stroke="${line}" stroke-linejoin="round"/>`;
  return (
    face([[x, y + d, z], [x + w, y + d, z], [x + w, y + d, z + h], [x, y + d, z + h]], tone(base, -0.22)) +
    face([[x + w, y, z], [x + w, y + d, z], [x + w, y + d, z + h], [x + w, y, z + h]], base) +
    face([[x, y, z + h], [x + w, y, z + h], [x + w, y + d, z + h], [x, y + d, z + h]], tone(base, 0.28))
  );
}
docs/arch/draw.mjs, part 1: projection, tones and a box. U is the size of one world unit in pixels. Needs the yaml package (npm install yaml).
One shape per kind, built from boxes and cylinders
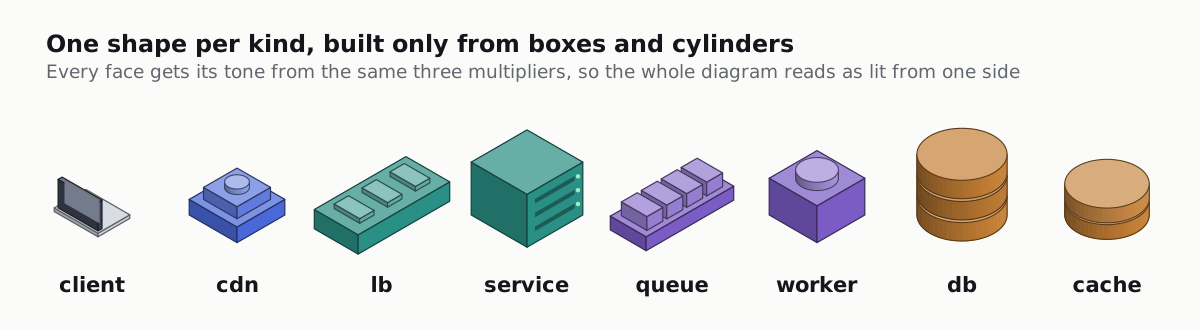
A cylinder in isometric view is a rectangle with an ellipse on top and a half ellipse at the bottom. A circle of radius r on the floor projects to an ellipse with radii r × √2 × cos 30° across and r × √2 × 0.5 down, both times the unit size. A left-to-right gradient gives the curved side its shading.
function cylinder(cx, cy, z, r, h, base) {
  const [x, top] = iso(cx, cy, z + h);
  const [, bottom] = iso(cx, cy, z);
  const rx = r * Math.SQRT2 * C30 * U, ry = r * Math.SQRT2 * 0.5 * U;
  const id = `side-${Math.round(x)}-${Math.round(bottom)}`;
  const line = tone(base, -0.55);
  return (
    `<linearGradient id="${id}"><stop offset="0" stop-color="${tone(base, -0.25)}"/><stop offset="1" stop-color="${base}"/></linearGradient>` +
    `<path d="M ${x - rx} ${top} V ${bottom} A ${rx} ${ry} 0 0 0 ${x + rx} ${bottom} V ${top} Z" fill="url(#${id})" stroke="${line}"/>` +
    `<ellipse cx="${x}" cy="${top}" rx="${rx}" ry="${ry}" fill="${tone(base, 0.28)}" stroke="${line}"/>`
  );
}

// Half sizes on the floor (for routing) and heights (for labels), per kind.
const HALF = { client: [0.55, 0.4], cdn: [0.6, 0.6], lb: [0.55, 1.15], service: [0.7, 0.7], db: [0.8, 0.8], cache: [0.75, 0.75] };
const HEIGHT = { client: 0.7, cdn: 0.6, lb: 0.42, service: 1.15, db: 1.38, cache: 0.68 };

const SHAPES = {
  client: (x, y, c) => box(x - 0.55, y - 0.4, PH, 1.1, 0.8, 0.7, c),
  cdn: (x, y, c) => box(x - 0.6, y - 0.6, PH, 1.2, 1.2, 0.34, c) + box(x - 0.42, y - 0.42, PH + 0.34, 0.84, 0.84, 0.26, tone(c, 0.12)),
  lb: (x, y, c) => box(x - 0.55, y - 1.15, PH, 1.1, 2.3, 0.42, c),
  service: (x, y, c) => box(x - 0.7, y - 0.7, PH, 1.4, 1.4, 1.15, c),
  db: (x, y, c) => [0, 1, 2].map((k) => cylinder(x, y, PH + k * 0.46, 0.8, 0.4, c)).join(''),
  cache: (x, y, c) => cylinder(x, y, PH, 0.75, 0.32, c) + cylinder(x, y, PH + 0.36, 0.75, 0.32, c),
};
draw.mjs, part 2: a cylinder and the shapes for each kind. Shapes stand on the platform top (z = PH).
If you want figures of this kind without writing the renderer, our Isometric explainers skill has Claude Code draw crafted isometric figures for docs, with built-in layout, motion and geometry checks.
Route connections on the floor
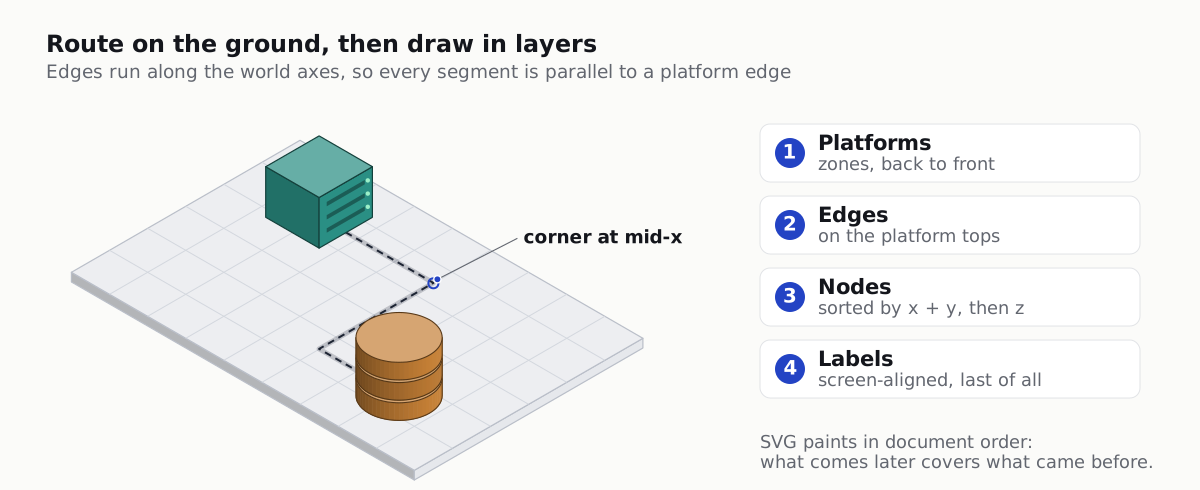
Diagonal lines in an isometric drawing look like they are flying through the air. Route every connection on the floor instead, along the two world axes: leave the source along x, turn at a corner halfway, run along y, then turn again into the target. Projected, every segment is parallel to a platform edge, and the diagram looks built rather than sketched.
function route(a, b) {
  const [ax, ay] = a.at, [bx, by] = b.at;
  const start = [ax + HALF[a.kind][0], ay];
  const end = [bx - HALF[b.kind][0] - 0.12, by];
  if (ay === by) return [start, end];
  const midX = (start[0] + end[0]) / 2;
  return [start, [midX, ay], [midX, by], end];
}

function edge(points) {
  const p = points.map(([x, y]) => iso(x, y, PH + 0.01));
  const d = 'M ' + p.map((q) => q.map((v) => v.toFixed(1)).join(' ')).join(' L ');
  const [[x1, y1], [x2, y2]] = p.slice(-2);
  const a = Math.atan2(y2 - y1, x2 - x1);
  const head = [a - 0.45, a + 0.45].map((t) => `${(x2 - 11 * Math.cos(t)).toFixed(1)},${(y2 - 11 * Math.sin(t)).toFixed(1)}`);
  return (
    `<path class="flow" d="${d}" fill="none" stroke="#1d2433" stroke-width="2" stroke-dasharray="7 5"/>` +
    `<polygon points="${x2.toFixed(1)},${y2.toFixed(1)} ${head.join(' ')}" fill="#1d2433"/>`
  );
}

const platform = (z) => box(z.x[0], 0, 0, z.x[1] - z.x[0], 6.2, PH, '#e6e8ec');

// The dash moves to show the direction of flow; it stands still for readers who ask for less motion.
const STYLE = `<style>@keyframes flow{to{stroke-dashoffset:-24}}.flow{animation:flow 1.4s linear infinite}
@media (prefers-reduced-motion: reduce){.flow{animation:none}}</style>`;
draw.mjs, part 3: an L-shaped route, an arrow with a moving dash, and a platform per zone.
Painter’s order for a diagram
SVG has no depth buffer: whatever comes later in the file covers what came before. A diagram needs only four layers, in this order:
- Platforms, from back to front.
- Edges, which lie on the platform tops, so every node later covers the ends of its connections.
- Nodes, sorted by
x + yof their floor position: a larger sum is nearer to the viewer, so it is drawn later. - Labels, last, so no shape ever covers a name.
Sorting by x + y is enough here because nodes are compact and sit on a grid with space between them. Long parts that overlap other parts on screen need a stronger rule; the docs figures guide has the overlap test for that case.
Labels that stay readable
Do not skew text onto the isometric planes. Slanted words look clever and read slowly. Keep labels flat to the screen, centred above each node, with a halo in the background colour so they stay legible where they cross a line. A small greedy pass moves a label up when it would overlap one placed before it.
const placed = [];
const esc = (s) => String(s).replace(/&/g, '&').replace(/</g, '<');
function label(n) {
let [x, y] = iso(n.at[0], n.at[1], PH + HEIGHT[n.kind]);
y -= 16;
const w = n.label.length * 8.5;
while (placed.some((p) => Math.abs(p.x - x) < (p.w + w) / 2 && Math.abs(p.y - y) < 18)) y -= 18;
placed.push({ x, y, w });
return `<text x="${x.toFixed(1)}" y="${y.toFixed(1)}" text-anchor="middle" font-family="system-ui" font-size="15" ` +
`font-weight="600" fill="#14161c" stroke="#fbfbf9" stroke-width="5" paint-order="stroke">${esc(n.label)}</text>`;
}
const color = Object.fromEntries(spec.zones.map((z) => [z.id, z.color]));
const nodes = Object.values(spec.nodes).sort((a, b) => a.at[0] + a.at[1] - (b.at[0] + b.at[1]));
const flow = spec.edges.map(([a, b]) => `${spec.nodes[a].label} to ${spec.nodes[b].label}`).join('; ');
const body =
spec.zones.map(platform).join('') +
spec.edges.map(([a, b]) => edge(route(spec.nodes[a], spec.nodes[b]))).join('') +
nodes.map((n) => SHAPES[n.kind](n.at[0], n.at[1], color[n.zone])).join('') +
nodes.map(label).join('');
process.stdout.write(
`<svg xmlns="http://www.w3.org/2000/svg" viewBox="0 0 1200 700" role="img" aria-labelledby="t d">` +
`<title id="t">System architecture</title><desc id="d">${esc(flow)}</desc>${STYLE}${body}</svg>\n`,
);draw.mjs, part 4: labels, the accessible title and description, and the assembled SVG.
The <desc> lists every connection in words, generated from the same spec, so a screen reader gets the architecture too and the description can never drift from the picture. Embed the file with <img src="system.svg" alt="..."> in docs; the moving dash keeps working there, and it stops for readers who set reduced motion.
Start the node list from Terraform
If the infrastructure is in Terraform, the state already knows what exists. terraform show -json prints every managed resource with its type and address, nested by module. A short script turns the resource types you care about into node stubs; you then give each a position and write the edges, because state does not say which service calls which.
const KIND = {
  aws_cloudfront_distribution: 'cdn',
  aws_lb: 'lb',
  aws_ecs_service: 'service',
  aws_lambda_function: 'service',
  aws_sqs_queue: 'queue',
  aws_db_instance: 'db',
  aws_rds_cluster: 'db',
  aws_elasticache_replication_group: 'cache',
};

let input = '';
for await (const chunk of process.stdin) input += chunk;

const walk = (m) => [...(m.resources ?? []), ...(m.child_modules ?? []).flatMap(walk)];
const resources = walk(JSON.parse(input).values?.root_module ?? {});

for (const r of resources.filter((r) => r.mode === 'managed' && KIND[r.type])) {
  console.log(`  ${r.name}: { kind: ${KIND[r.type]}, zone: TODO, at: [0, 0], label: ${r.name} }  # ${r.address}`);
}
tf-nodes.mjs: terraform show -json | node tf-nodes.mjs >> nodes.draft.yaml
Regenerate in CI and review the diff
The point of diagrams as code is that they cannot go stale silently. Commit both the YAML and the SVG, and have CI redraw the SVG and fail when it differs from the committed one. Reviewers then see the YAML change and the picture change in the same pull request.
- uses: actions/setup-node@v4
  with: { node-version: 20 }
- run: npm ci
- run: node docs/arch/draw.mjs > docs/arch/system.svg
- run: git diff --exit-code docs/arch/system.svg
.github/workflows/docs.yml (steps only)
Next: for figures that explain one mechanism rather than a whole system, read isometric SVG diagrams for technical docs with Claude Code, or make the figure move with exploded view animation in code.