Isometric SVG diagrams for technical docs with Claude Code
A system drawn as a real machine explains itself faster than boxes and arrows. Here is how to brief Claude Code for an interactive, accessible figure, check what it draws and ship it in your docs.
By Homingo Learn ·
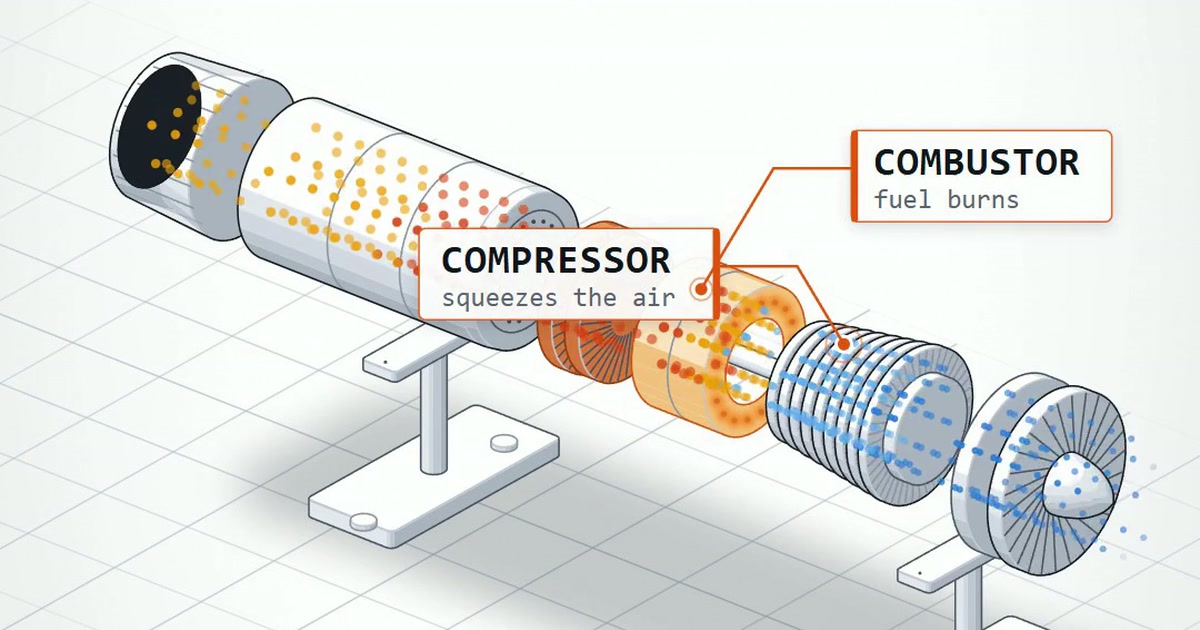
When an isometric figure beats a flowchart
Flowcharts are good at order: this step, then that one. They are weak at mechanism: why a request waits, where a value is kept, what fills up and what drains. An isometric drawing shows depth, so the reader sees which part sits inside which, what is in front of what, and where things connect. That is why many hardware manuals draw exploded machines rather than boxes.
- Use one for the hero figure of a concept page, a design doc that explains a mechanism (rate limiting, caching, queues, retries), a launch post, or a talk slide that has to land in five seconds.
- Skip it for reference material that changes every week, sequence diagrams with many actors, or anything a table says better. A plain diagram that stays correct beats a beautiful one that goes stale.
Two neighbours of this guide: isometric architecture diagrams as code for whole systems, and data structure animation for stacks, queues and trees.
Pick a physical metaphor first
The figure works when the reader already knows how the object behaves. Choose the object before you think about colours or layout. A few that map well onto common software ideas:
- Rate limiter: a gate on a conveyor belt that takes one token per request from a column of tokens; an empty column sends the request to a reject bin.
- Queue and workers: a belt feeding several stations; a backed-up belt is visible at a glance.
- Cache: a cabinet of labelled drawers next to a slow warehouse; a hit opens a drawer, a miss walks to the warehouse.
- Load balancer: a sorting gate that sends parcels down different chutes.
- CI pipeline: an assembly line with inspection stations that can stop the line.
Test the metaphor in one sentence: "Each request spends one token at the gate; with the column empty, it goes to the 429 bin." If you cannot say it in one sentence, the figure will likely need a legend, which weakens its main advantage.
Write a figure brief before you ask Claude
Claude Code draws much better figures from a short brief than from "make a diagram of our rate limiter". The brief fixes the parts, what the reader must notice and what moves, so the first render is close and the review rounds stay short. Keep it in the repo next to the docs page, so the figure can be regenerated when the system changes.
Figure: token-bucket rate limiter, for the "Rate limits" docs page.
One-sentence story: each request spends one token at the gate; with the
column empty, the request drops into the 429 bin; tokens refill at a fixed rate.

Parts: token column with refill pipe, gate, conveyor belt, API box at the
end of the belt, 429 bin beside the gate. The generator sorts parts back to
front from their positions and splits long parts (belt, pipe) into segments.
Labels: "Tokens", "Gate", "API", "429" (short, one leader line each, no overlaps).
Readouts in the SVG as <tspan> elements with ids: rl-tokens-left (n/8),
rl-served, rl-rejected, rl-traffic-value, rl-refill-value.
Motion: requests ride the belt; a token leaves the column each time a
request passes the gate; a token drops in from the refill pipe at the
refill rate; nothing else moves.
Controls (page HTML, not in the SVG): sliders "Traffic" (req/s) and "Refill" (tokens/s).
Look: light background, light from the top right (top faces lightest, left
faces darker than right), mid-tone colours, a system font stack; text at
least 12 px when rendered at the docs column width (scale font-size up if
the column is narrower than 640 px).
Output: one standalone SVG, viewBox 0 0 640 400; prefix every id, class and
keyframe with rl-; respect prefers-reduced-motion.
docs/figures/rate-limiter.brief.md
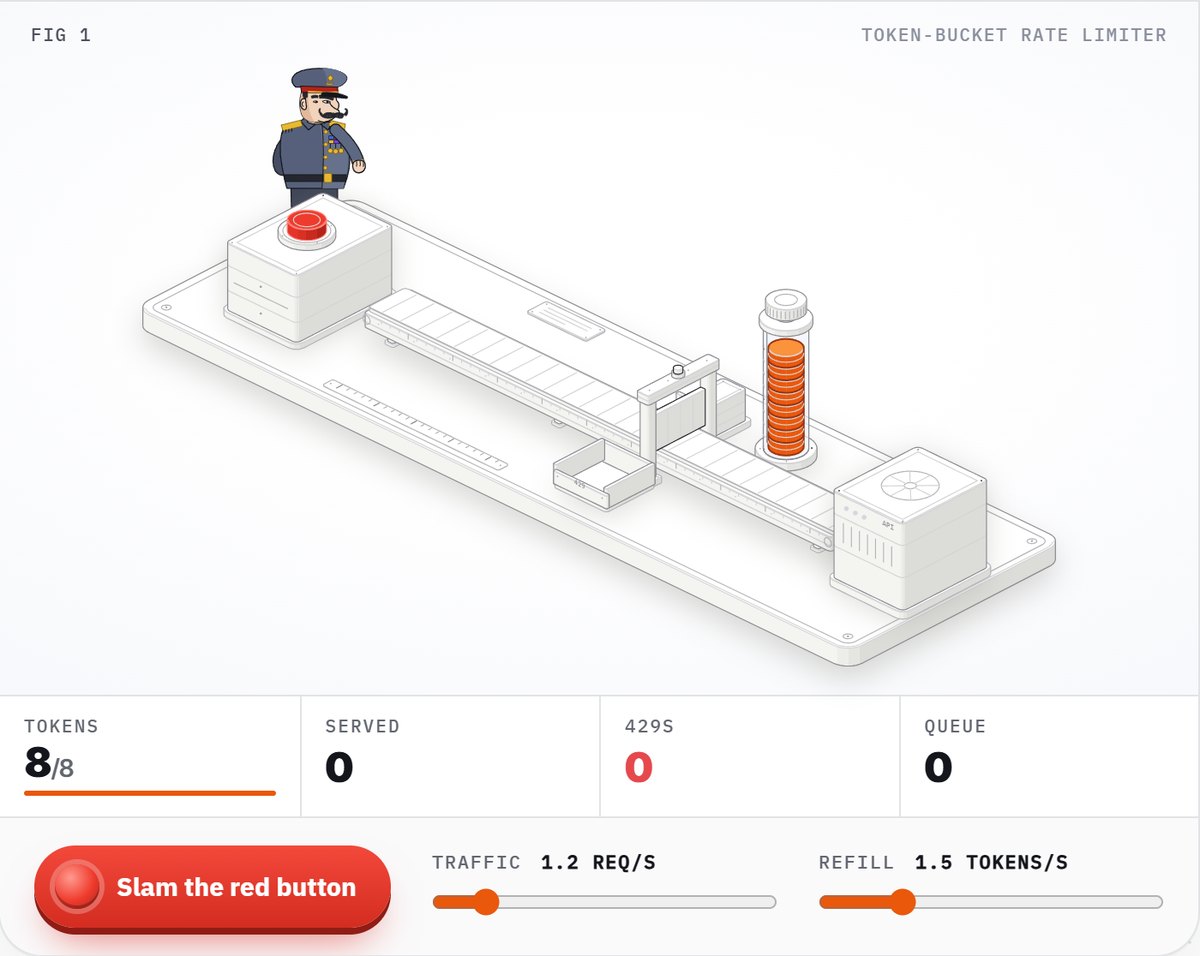
Our Isometric explainers skill turns a brief like this into a finished figure, with layout, motion and geometry checks built in, and one command turns the same figure into a 1080x1920 reel.
Isometric projection, shading and depth, in brief
Three rules decide whether the result looks crafted or broken. Put them in the prompt so Claude does not guess.
- Projection: the x axis runs down-right and the y axis down-left, both 30 degrees below the horizontal, and z points straight up. A world point (x, y, z) lands on screen at
screenX = (x - y) * cos 30°andscreenY = (x + y) * sin 30° - z, times your unit size, plus an origin offset. In code that isMath.cos(Math.PI / 6)(about 0.866) and0.5;Math.cos(30)would read 30 as radians and skew the drawing. From this camera you see three faces of a box: the top, the face atx + width(screen right) and the face aty + depth(screen left). - Four tones: from one base colour make the top lighter, keep the right face at the base, make the left face darker and the outline darker still. The same multipliers for every material make the whole drawing read as lit from one side.
- Depth: SVG paints in document order, so far parts must come first, and a larger
x + yis nearer to the viewer. Sorting layer by layer (bottom z, then the near corner) works for compact parts; long parts break it. The robust way: compare only pairs whose screen outlines overlap. For such a pair, box A is behind box B whenA.x + A.w <= B.x, orA.y + A.d <= B.y, orA.z + A.h <= B.z. Build edges from those pairs only, sort topologically, and split a box only when a real cycle remains.
We walk through all three with a complete short script in Isometric diagrams in plain SVG: projection, four-tone shading and painter's order (on DEV).
Ask Claude Code for code that writes the SVG
Ask for a small script that generates the SVG, not for an SVG file typed out directly. A generator is diffable in review, takes the brief's numbers as parameters and can be re-run when the brief changes. Plain TypeScript or JavaScript with no framework keeps the output usable in any docs tool.
Read docs/figures/rate-limiter.brief.md. Write docs/figures/rate-limiter.ts:
a framework-independent TypeScript module that returns the figure as an SVG
string. Projection: x axis down-right and y axis down-left at 30 degrees,
z straight up; screenX = (x - y) * cos 30°, screenY = (x + y) * sin 30° - z
(Math.cos(Math.PI / 6) and 0.5). Shade every solid with four tones of its
base colour (top lightest, right face base, left face darker, outline
darkest). Order parts back to front: compare only pairs whose screen
outlines overlap, use the axis separation test, sort topologically, split
a part only on a real cycle. Root <svg>: xmlns, viewBox 0 0 640 400,
role="img", aria-labelledby="rl-title", aria-describedby="rl-desc", with
<title id="rl-title"> and <desc id="rl-desc">; prefix every id, class and
keyframe with rl-; set a system font stack inside the SVG.
Add docs/figures/build.ts that writes docs/figures/rate-limiter.svg (path
resolved relative to build.ts), run it with npx tsx docs/figures/build.ts,
then list anything in the brief you could not do.
Prompt in Claude Code (run once beforehand: npm i -D tsx)
Node 22.18 or newer can also run build.ts directly with node docs/figures/build.ts, as long as the code uses only erasable TypeScript (no enums or namespaces) and imports with explicit .ts extensions (import { render } from './rate-limiter.ts'); otherwise stay with tsx. If you make figures often, move the brief template and the checklist below into a skill so every figure starts the same way (see how to write a SKILL.md).
Review the render with a checklist
Open the SVG at the width your docs column really shows it, not zoomed in. Then go through this list before you read any code:
- Order: no part pokes through one that should be in front of it. Long parts (pipes, belts) are where back-to-front sorting usually breaks.
- Light: every top face is the lightest and every left face is darker than its right face, so the whole figure reads as lit from one side.
- Grounding: every part stands on something; nothing floats unless floating is the point.
- Labels: short, never over a part they do not name, leader lines that do not cross.
- Text size: at least 12 px at the docs column width. Then check the page at 360 px wide; if labels shrink below reading size, enlarge them or ship a narrower variant of the figure for small screens.
- Story: a new reader can say the one-sentence story after five seconds without the caption.
Give Claude the failures as one numbered list in a single message ("1. the pipe paints over the pump; 2. the 429 label covers the gate") rather than one at a time. A clear brief keeps the review rounds short.
Embed it in your docs, accessibly
How you include the SVG decides what it can do. Referenced with <img src="rate-limiter.svg" alt="..."> (or Markdown image syntax), the SVG is drawn like a picture: scripts do not run and it cannot load other files (web fonts included, hence the system font stack), but CSS animation inside it still plays. That is the safe default for a static figure. For sliders and live readouts, put the SVG inline in the page: pasted into the HTML, or imported as a component in MDX with SVGR or your docs tool's SVG loader. A same-origin <object> also works: wait for its load event, then use obj.contentDocument.getElementById(...). The scripts below assume the inline option.
<svg xmlns="http://www.w3.org/2000/svg" viewBox="0 0 640 400"
     role="img" aria-labelledby="rl-title" aria-describedby="rl-desc">
  <title id="rl-title">Token-bucket rate limiter as a machine</title>
  <desc id="rl-desc">Requests ride a belt to a gate. Each one takes a token
    from the column; with the column empty, the request drops into the 429 bin.
    Tokens refill at a fixed rate.</desc>
  <style>
    .rl-belt { stroke-dasharray: 12 12; animation: rl-roll 2s linear infinite; }
    @keyframes rl-roll { to { stroke-dashoffset: -24; } }
    @media (prefers-reduced-motion: reduce) { .rl-belt { animation: none; } }
  </style>
  <!-- parts, back to front -->
</svg>
The accessible root of an inline figure, with motion that stops for readers who ask for less
- Write the
<desc>as the one-sentence story, not as a list of shapes: a screen reader user needs the mechanism, not "orange cylinder". - Styles inside an inline SVG are not scoped to it: they apply to the whole page. Prefix classes, keyframes and ids per figure (
rl-above) so two figures on one page do not clash. - With SVGR, turn SVGO off for these figures (
svgo: false) or keep itscleanupIdsandremoveTitleplugins disabled, so the ids, the title and the styles survive the build. - Pasted raw into an MDX page, the
<style>block does not compile (a brace starts a JSX expression) and attributes need camelCase. Import the file through the loader instead, or wrap the CSS in a template string inside<style>{...}</style>.
Make it interactive (only where it teaches)
A slider earns its place when moving it shows the idea: drag the refill rate below the traffic rate and watch the 429s climb. Keep the simulation in your page script and write only the numbers into the inline SVG. Text inside a role="img" figure is not read out, so give each slider an aria-valuetext, and if you announce totals, use one polite live region that updates every few seconds, never on every tick. Place the scripts after the figure, or move them to a file loaded with <script src="figure.js" defer> (defer does nothing on an inline script).
<label>Traffic <input id="rl-traffic" type="range" min="0.5" max="6" step="0.5" value="1"></label>
<label>Refill <input id="rl-refill" type="range" min="0.5" max="4" step="0.5" value="1.5"></label>
<script>
  for (const [id, unit] of [['rl-traffic', 'requests per second'], ['rl-refill', 'tokens per second']]) {
    const input = document.getElementById(id);
    const show = () => {
      input.setAttribute('aria-valuetext', input.value + ' ' + unit);
      document.getElementById(id + '-value').textContent = input.value;
    };
    input.addEventListener('input', show);
    show();
  }
</script>
Sliders in the page; the rl-traffic-value and rl-refill-value tspans live in the figure
const still = matchMedia('(prefers-reduced-motion: reduce)').matches;
const el = (id) => document.getElementById(id);
const traffic = el('rl-traffic'), refill = el('rl-refill');
const sim = { tokens: 8, due: 0, served: 0, rejected: 0 };
let last = performance.now();
setInterval(() => {
  const now = performance.now(), dt = (now - last) / 1000;
  last = now;
  sim.tokens = Math.min(8, sim.tokens + Number(refill.value) * dt);
  sim.due += Number(traffic.value) * dt;
  for (; sim.due >= 1; sim.due -= 1) {
    if (sim.tokens >= 1) { sim.tokens -= 1; sim.served += 1; }
    else sim.rejected += 1;
  }
  el('rl-tokens-left').textContent = Math.floor(sim.tokens) + '/8';
  el('rl-served').textContent = sim.served;
  el('rl-rejected').textContent = sim.rejected;
  if (!still) { /* move the requests and tokens in the figure here */ }
}, 100);
A minimal token bucket behind the figure: capacity 8, ticks ten times a second
With reduced motion on, the numbers still update; only the parts stay put. Set traffic to 4 and refill to 1: the column empties within a few seconds and from then on about three requests in four land in the 429 bin.
Export a PNG for slides and link previews
Slides, social cards and some docs tools want a bitmap. Headless Chrome renders the standalone SVG (your page CSS does not apply, and the font named in the SVG must be installed on the machine that renders it). --force-device-scale-factor=2 gives a sharp 2x image and --force-prefers-reduced-motion keeps animated parts still. Run it from docs/figures:
google-chrome --headless --screenshot=rate-limiter.png \
  --window-size=640,400 --force-device-scale-factor=2 \
  --force-prefers-reduced-motion \
  "file://$PWD/rate-limiter.svg"
Linux: google-chrome, chromium or chromium-browser. macOS: "/Applications/Google Chrome.app/Contents/MacOS/Google Chrome". Windows: "C:\Program Files\Google\Chrome\Application\chrome.exe" with a file:///C:/... URL. Spaces in the path must be written as %20 in the URL.
Match --window-size to the SVG's viewBox so nothing is cropped or padded. For link previews, render a separate 1200x630 framing of the same figure rather than stretching the docs version.
To take a figure to video, see exploded view animation for explainer reels, or in Hinglish, educational animation video kaise banaye.